TECHNOLOGY BRIEF
Zero-Impact Crash Recovery for Kx Kdb+
SOLUTION
Big Memory
Introduction
Snapshotting kdb+ databases to storage can be disruptive which discourages frequent snapshots and lengthens RPO. This technology brief explains how MemVerge Memory Machine™ software can deliver Zero-Impact Crash Recovery. This is accomplished by providing snapshot functionality on a primary database server with near zero impact on performance or resources of the primary database. All database transactions are replayed on a secondary server whose DRAM and PMEM are managed by MemVerge Memory Machine to provide frequent ZeroIO™ snapshots and minimize the failover / restore time.
Memory Machine Software Overview
Memory Machine serves as the foundation for applications to enjoy the benefits of softwaredefined memory including rich in-memory data services. Applications can allocate their inmemory data structures and runtime states transparently from a large pool of tiered memory. DRAM and Persistent Memory (PMEM) are flexibly combined to provide both large capacity and close-to-DRAM memory access speed. With memory being managed by Memory Machine, applications can further leverage multiple enterprise data services to gain better performance and higher reliability. For instance, Memory Machine’s ZeroIO Snapshot allows instant capture of an application’s running state, which in turn enables instant application restart and recovery.
Memory Services
ZeroIO Snapshots
Snapshots capture an applications state at a given point-in-time and persist the data to PMEM within the memory tier. Since ZeroIO snapshots don’t write to disk, this operation is very fast, and typically freezes the application for a fraction of a second. Because Memory Machine snapshots have such low-overhead, admins can consider frequent snapshots to meet recover point objectives.
App-Specific Recovery
For applications that support logging and replay, Memory Machine has a procedure to restore from a snapshot and then call app specific scripts to replay database logs to synchronize the latest transactions. For applications that support logging and replay, such as kdb+, MemVerge Memory Machine has a procedure to create an asynchronous replica without impact to or the knowledge of the primary application. Snapshots of the replica can then be taken instead of the primary app. In this case we can achieve ultra-fast failover without snapshotting the primary.
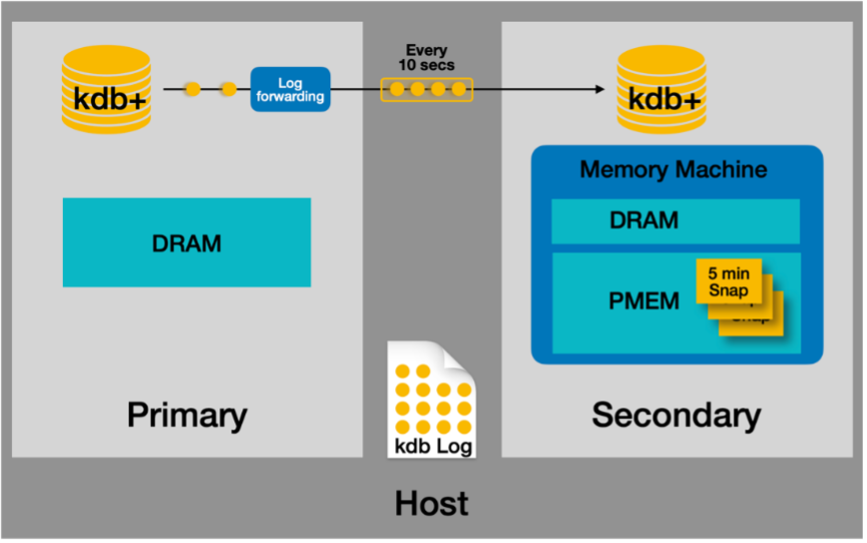
Figure-1 below shows how Zero-Impact Crash Recovery works. A small log forwarding helper program is installed on the primary machine which simply forwards new kdb+ log entries to the secondary machine every 10 seconds. The secondary machine replays the log entries, and then creates a snapshot every 5 minutes. In the event of a failover, the secondary recovers to the latest snapshot and replays the missing portion of the log.
Figure 1 – How Zero-Impact Crash Recovery Works
Application Performance
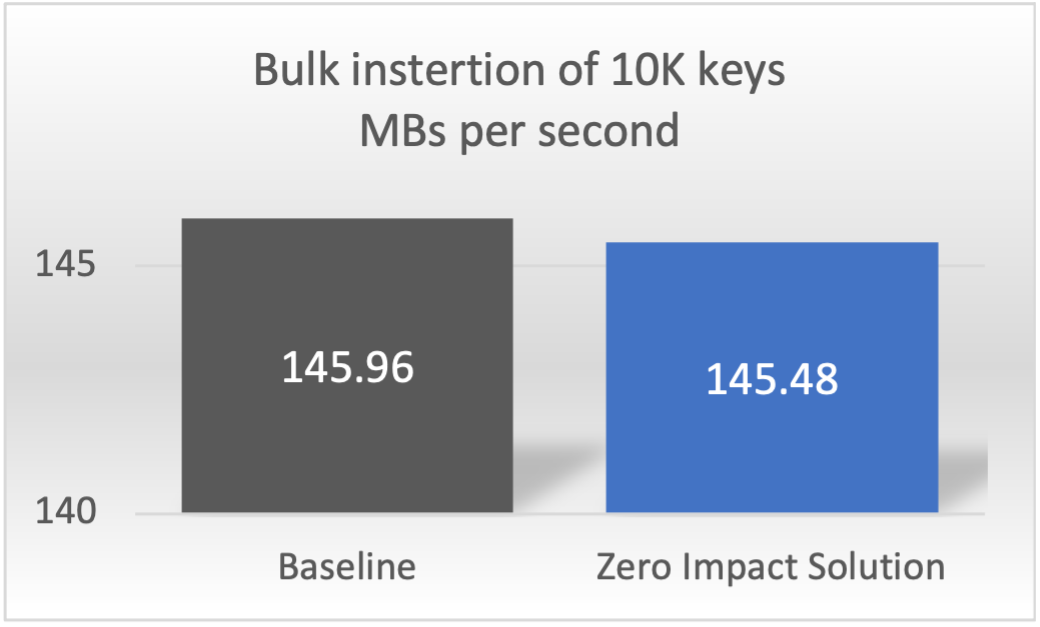
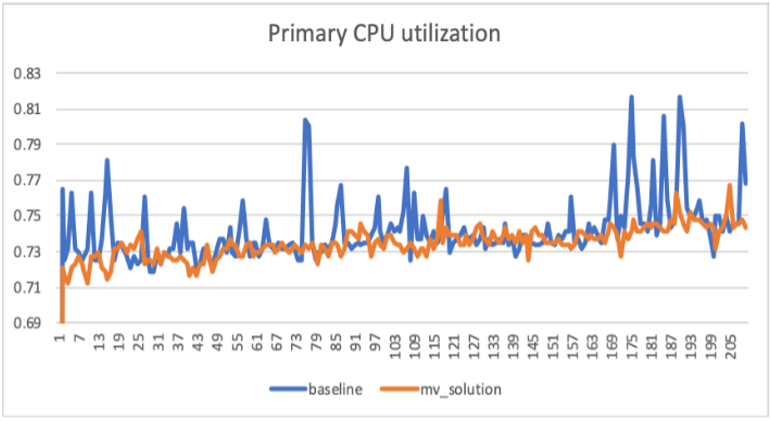
The graphs in Figure 2 below show that adding the MemVerge asynchronous log forwarding service to the primary server adds very little performance overhead in either I/O throughput or CPU utilization.
Figure 2 – Zero-Impact to I/O Throughput and CPU Utilization
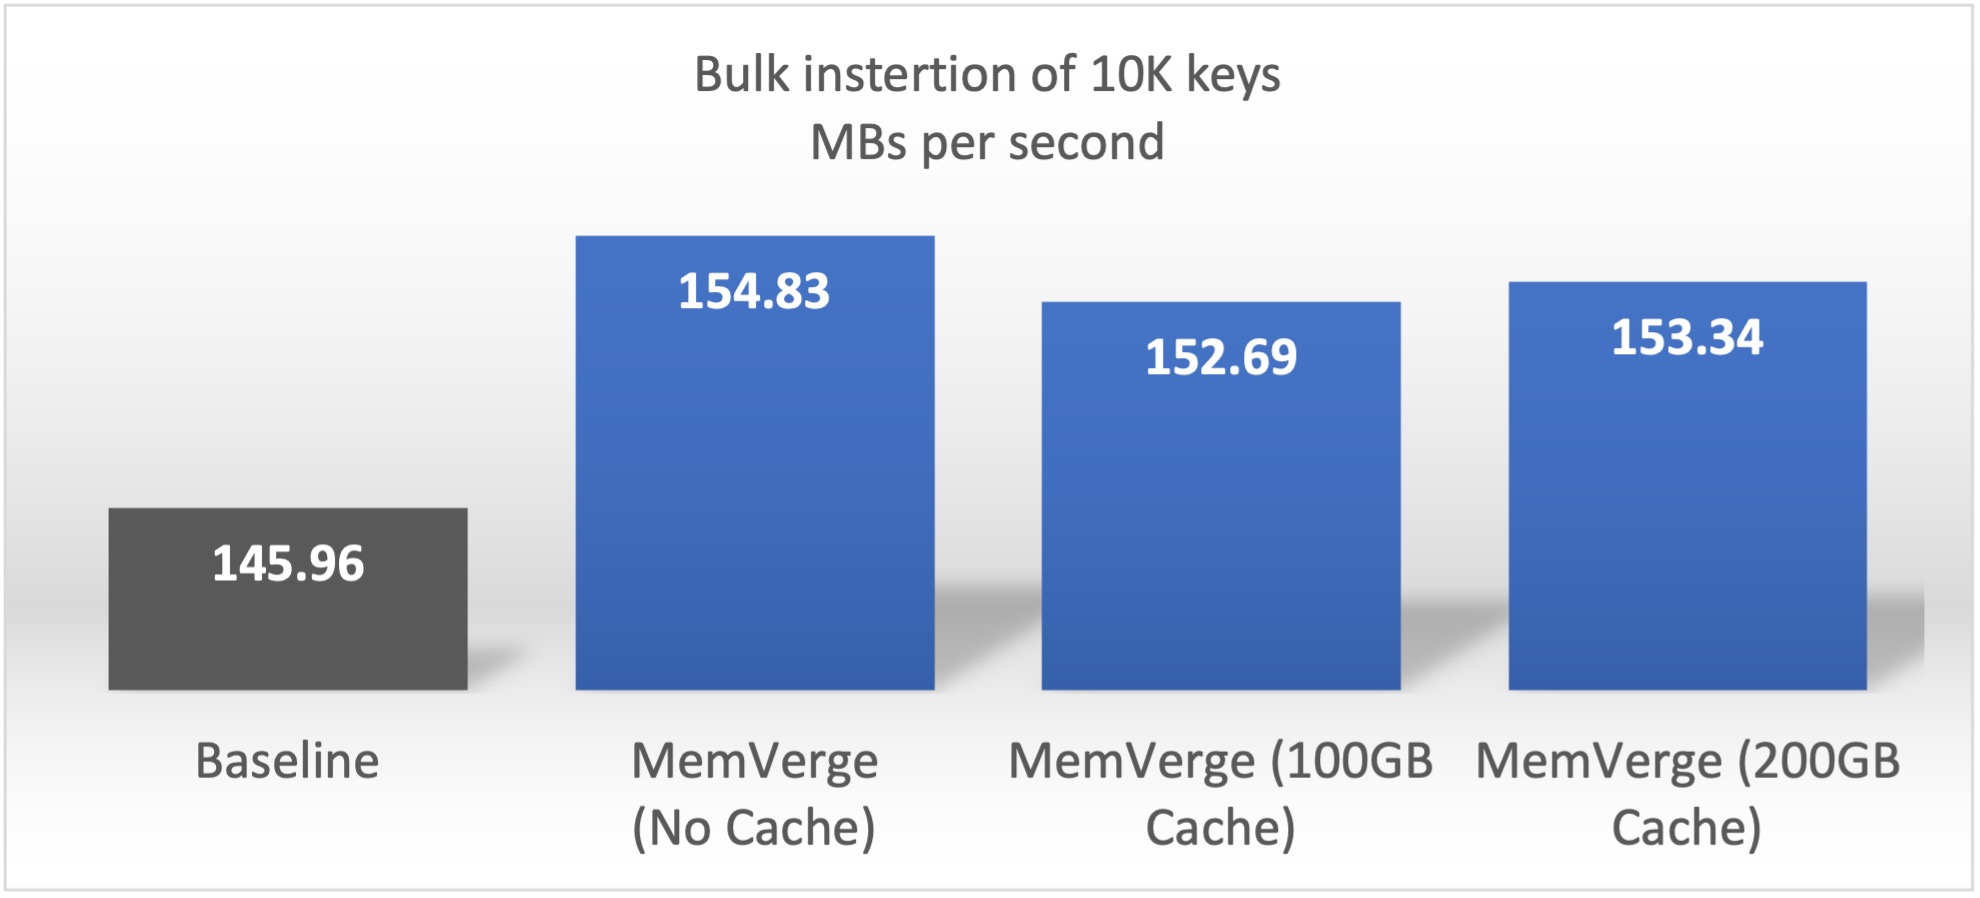
The graph in Figure 3 below shows the throughput of adding 271.6GB of 10K keys in kdb+ to the baseline configuration running on DRAM and comparing it to the “failover” configurations running MemVerge with different ratios of DRAM cache and PMEM. The MemVerge configurations show higher throughput in all cases.
Figure 3 – Higher Kdb+ Bulk Insert Throughput with PMEM & Memory Machine
Restore Performance
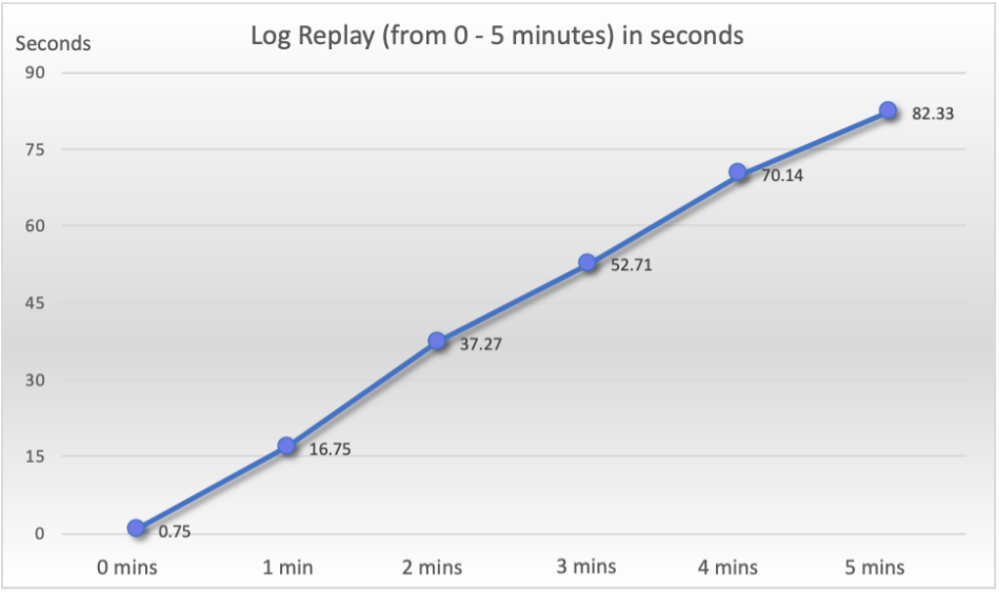
Snapshots are taken every 5 minutes on the standby machine. This graph shows the seconds needed to replay the kdb log from 0 minutes after the last snapshot was taken, to the maximum, 5 minutes after the last snapshot was saved. This is based on the above sample of inserting 10K keys at a rate of 145.48 MB/s.
Figure 4 – Time to Replay Kdb+ Log after Last Snapshot
Performance Test
Details The test configuration consists of two physical servers, a non-dedicated one running the client (workload generator) and a dedicated one (system under test) running either the primary kdb+ instance (baseline); or the primary kdb+, the secondary kdb+ (log-replay replica), and the MemVerge log manager. In order to generate the performance results, we first established a baseline by inserting 271.6GB worth of 10K keys into the kdb+ database. We ran this test 4 times which generated an average throughput of 145.96 MB/s.
We repeated this test on four different configurations:
1. Primary with log forwarding program installed
2. MemVerge secondary with no DRAM cache
3. MemVerge secondary with 100GB DRAM cache
4. MemVerge secondary with 200GB DRAM cache
Hardware Configuration
Server Machine
Intel Server model S2600WFD with two Intel(R) Xeon(R) Platinum 8260L(24 core @ 2.40GHz), 374 GB DRAM and 6 TB PMEM
Dax devices used in experiment
Primary server: /dev/dax0.3, nuna: 0, size: 590.62GiB
Secondary server: /dev/dax1.1, numa:1, size: 1476.56GiB
Numa info: 2 nodes (0-1)
| Node 0 | CPUs | 0 - 23 |
| Size | 191,900 MB DRAM | |
| Distance | 10, 21 | |
| Node 1 | CPUs | 24 - 47 |
| Size | 191,993 MB DRAM | |
| Distance | 21, 10 |
Hugepagesize: 2048 kB
NIC speed: 1000Mb/s
Filesystem for kdb log is on a dedicated 480GB ext4 formatted SSD:
Model Number: INTEL SSDSC2KG480G7
Serial Number: BTYM747201LU480BGN
Firmware Revision: SCV10142
Transport: SATA Rev 3.0
Client machine
CPU: Two Intel(R) Xeon(R) Gold 6238M CPU @ 2.10GHz(22 core)
185G DRAM
Before Crash
Baseline experiment:
Server
Start primary on server machine and bind with numa node 0. The primary logs to SSD and listens to port 5000 on 1000Mb/s interface.
numactl -N 0 ./q /path/to/primary -l -p 10.0.0.16:5000
After 35 minutes, simulate a crash by sending a kill signal to the primary process.
Client
On the client machine, send data to server port 10.0.0.16:5000 until the server crashs. The client keeps bulk inserting 10k rows at a time.
Table schema and row request format:
trade:([]time:`time$();sym:`symbol$();price:`float$();size:`int$( )) `trade insert(09:30:00.000;`a;10.75;100)
Data Sampling
On the server side, a python helper program starts to sample the CPU RSS utilization every 10 seconds after the primary server starts.
On the client side, we record the timestamp after completing each 10k iteration of 10k bulk insertion requests. Later we calculate throughput with, throughput = (size of 100 million rows) / (time difference)
MemVerge Solution Experiment
Server
Start memory machine and bind dax0.3 to numa 0, bind dax1.1 to numa 1 with command
numactl -N 1 mvmallocd /dev/dax0.3:0 /dev/dax1.1:1
Start the primary server machine and bind with numa node 0. The primary logs to ssd and listens to a port on a 1000Mb/s network interface.
numactl -N 0 ./q /qlc_nvme/KX/kx/primary -l -p 10.0.0.16:5000
Start replication between machines and bind with numa 1. Replication logs to SSD, and listens to a local port.
mm -c /tmp/mvmalloc.yml numactl -N 1 ./q /qlc_nvme/KX/kx/sec -l - p 5010
ZeroIO snapshots are scheduled every 5 mins. At the same time, a helper program generates the catch-up log every 10 seconds, then sends log replay request to replica via local port 5010.
After 35 mins, send signals to kill both primary and replication process at the same time.
Client (same as baseline)
On client machine, send data to server port 10.0.0.16:5000 until the server crashes. The client keeps bulk inserting 10k row at a time.
Data sampling (same as baseline)
On server side, a python helper program starts to sample the CPU RSS utilization every 10 seconds after primary server starts.
On client side, we record the timestamp of completing each 10k iteration of 10k bulk insertion requests. Later we calculate throughput with, throughput = (size of 100 million rows) / (time difference)
Database Recovery
Snapshot restore time: Measure the time spent during
mvmcli snapshot restore -l <label>
Summary
The MemVerge Zero-impact Crash Recovery functionality provides a lightweight mechanism which can be integrated with your existing production kdb+ environment to forward log information to a standby machine which is snapshotted every 5 minutes. There is near-zero impact to the performance of the primary database instance. From the performance analysis we can see that in a failover event, the standby machine can restore from the last snapshot and replay the log in under 85 seconds.
The running performance after failover onto the MemVerge machine is on-par, or better, than the DRAM-only primary machine.
For applications with logging and replay, zero-impact snapshots may be used to achieve RPO = 0 and RTO of seconds with no application impact…. even for applications with terabytes of memory.
