MemoryViewer
Now Available
For decades, memory management was limited to capacity and utilization monitoring. The advent of composable memory – software-defined capacity, performance, and availability – has created the need for greater visibility into memory resources.
MemVerge has responded by developing “MemoryViewer,” a Linux-based software designed to help system admins plan the lowest cost and highest performance memory configurations in support of modern workloads, as well as optimize and troubleshoot memory usage in running servers.
MemVerge MemoryViewer Overview
MemoryViewer software gives system administrators comprehensive insight into the physical memory topology as well as the application memory utilization.
Memory topology and performance ensure configuration accuracy
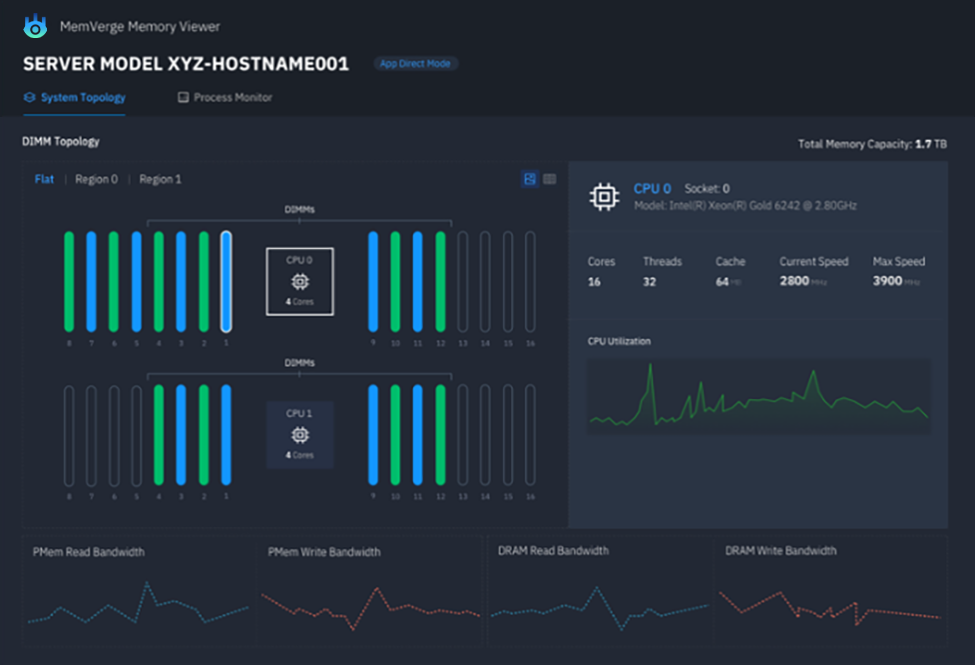
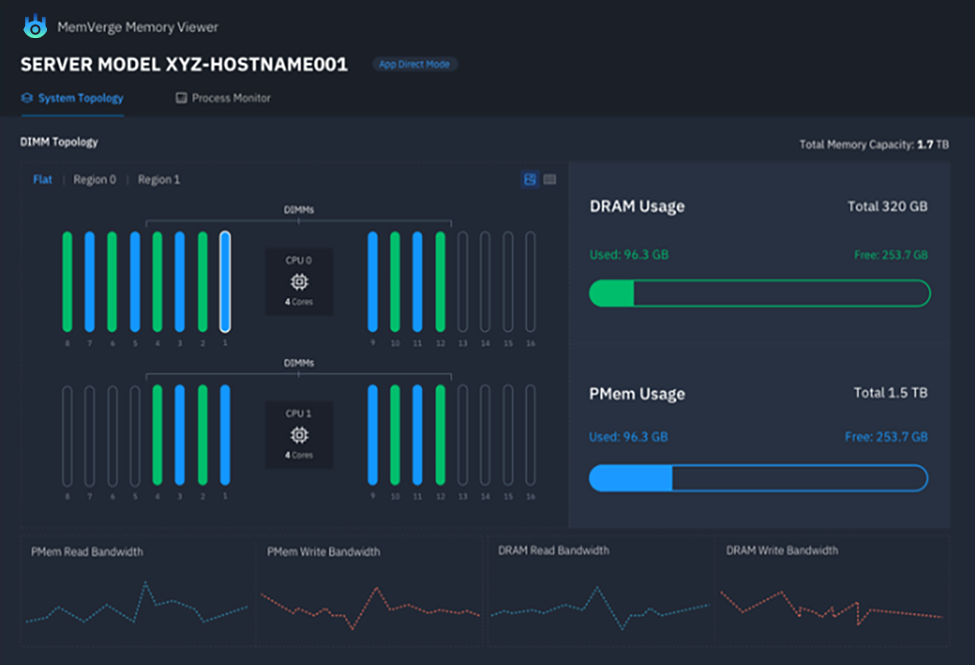
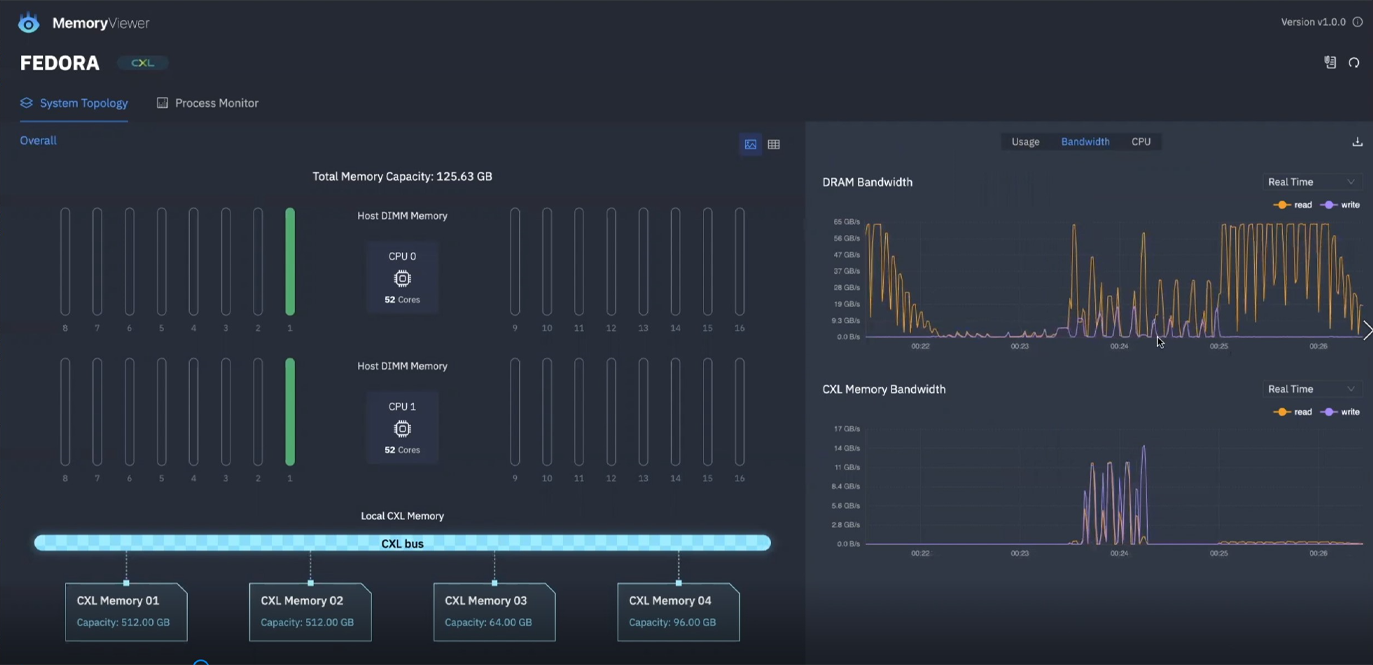
Servers are often equipped with tiered memory, such as Intel Optane PMem and/or CXL memory. The DIMM and CXL layouts, plus BIOS configurations on these servers can be complex and confusing. With its intuitive graphical interface, MemoryViewer provides a real-time view of the memory configuration as well as the bandwidth of each type of memory hardware.
Memory Heatmap helps plan best mix of DIMMs, PMem and CXL memory
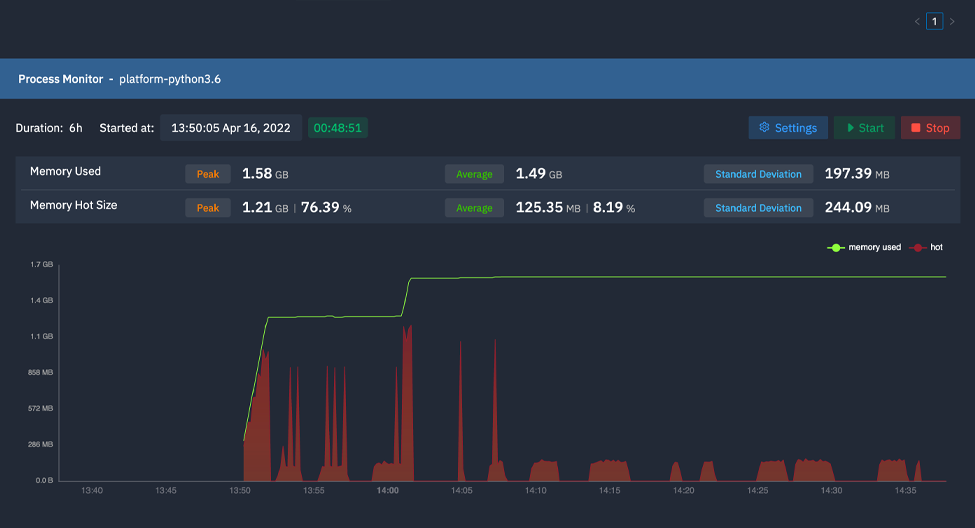
Many apps require large amounts of memory. However, they are often processing a tiny fraction of the data in memory at one time, leaving most of the reserved memory “cold.” These apps are prime candidates to take advantage of memory tiering and pooling where the cold data can be stored in lower cost shared memory. This approach will reduce hardware costs with minimal impact on app performance. The Memory Heatmap displays the memory usage patterns and with this insight, system admins can identify opportunities to optimize the memory configurations that best support their workloads.
Ease of Installation and Use
MemoryViewer software is available in RPM, Debian (DEB), or container packages, and installation on your Linux system is straightforward. It supports both a self-explanatory GUI and CLI.
Analyze App Memory Usage Patterns to help optimize
MemoryViewer shows the hot vs cold memory usages of applications so that system admins can determine the best memory configurations.
The MemoryViewer Memory Heatmap shows this workload only occasionally uses the memory capacity allocated. This workload is a perfect candidate for a tiered configuration of DRAM DIMMs and PMem or CXL memory.
Shows what’s in DIMM slots & BIOS to assist configuration
MemoryViewer reveals the physical layout of DIMM slots for each server socket, and CXL-connected memory.
There are strict guidelines for where and how many DRAM and PMem DIMMs can be configured. There are also guidelines for BIOS settings that must be met. MemoryViewer allows sys admins to easily see if their system is configured correctly.
Visual information useful for troubleshooting quickly
MemoryViewer can be a helpful troubleshooting tool with the ability to monitor the health and usage of your system memory, compiling a historical record of how applications are accessing memory, including allocating, writing, reading, and releasing memory pages.
MemoryViewer allows sys admins to correlate CPU utilization with read or write memory access, examine each module’s health and read-write bandwidth, and show a timeline of aggregate PMem and DRAM performance.
Coming Soon: Memory Viewer for CXL
MemoryViewer for CXL is available to technology partners upon request. See the software in action in this CXL Concept car video.
MemoryViewer Resources

Watch the MemoryViewer Demo Video
Help us Shape the Future of MemoryViewer
You are invited to give us feedback about:
-
-
- Memory visibility problems you’re experiencing and would like solved
- Features you would like to see in MemoryViewer
- Code that you would like to contribute to MemoryViewer
- Your experience using MemoryViewer
-
Request a Demo or Free Trial
We are happy to provide you a full demo, free trial, or access to play in a Sandbox set-up in AWS so that you can see the capabilities of the MemVerge solution. Get started for free!


Can MemVerge Memory Viewer v1.2.1 have the topology feature for the system emulated using QEMU/KVM? I tried the memory viewer with my virtual machine which can only show the DRAM total, DRAM used, Insight Groups like top 10 memory consumers.
I want to see the topology of my system NUMA node.